 Australian Uranium News - Research
Current Resistance 0.40


Targets
Six months: 0.47 ![]() One year: 0.55
One year: 0.55 ![]()
Supports
Support1: 0.33 ![]() Support2: 0.28
Support2: 0.28 ![]()
Resistances
Resistance1: 0.40 ![]() Resistance2: 0.47
Resistance2: 0.47 ![]()
Pivot Point
0.30 ![]()
Moving Averages
MA(5): 0.31 ![]() MA(20): 0.31
MA(20): 0.31 ![]()
MA(100): 0.33 ![]() MA(250): 0.21
MA(250): 0.21 ![]()
MACD
MACD(12,26): ![]() Signal(12,26,9): -0.01
Signal(12,26,9): -0.01 ![]()
Stochastic Oscillator
%K(14,3): 73.15 ![]() %D(3): 56.05
%D(3): 56.05 ![]()
RSI
RSI(14): 66.16 ![]()
52-Week
High: 0.47 Low: 0.10 Change(%): 46.0
Average Volume(K)
3-Month: 1255 10-Days 1862.040039
Here's Yesterday's DYL Intra-Day Trading
from Wednesday 9th Sept 2009
Click Chart To Enlarge
Chart Below Showing Cross-Over of
Buyers~~~~over Sellers~~~~~
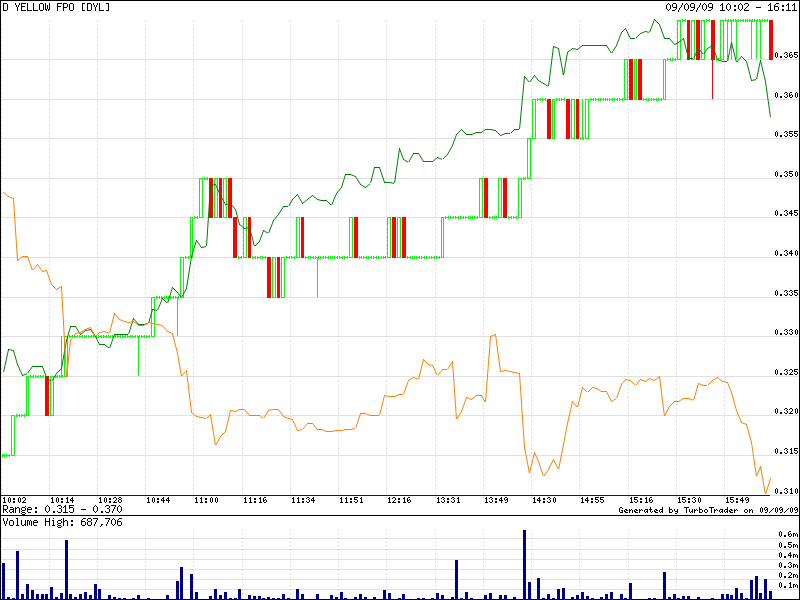
# Rising Volume for 3 days
# Volume trading above 4x ADV
# Closed outside top bollinger
# Gapped Up
$
CURRENT DYL TRADING UPDATE
Thursday 10th Sept 2009
As At 2.00P.M.
Click Chart To Enlarge

.
No comments:
Post a Comment